
はじめに
資料作成中に「もっと見栄えの良いグラフを作りたいんだけどな~」なんて思ったことありませんか?
特にMATLABのグラフだと下図のようになりがち。。。。

図1
最近、私はサイバーパンク風のデザインにはまっています。そこで、MATLABのplotをサイバーパンク風にできないか考えてみました。
MATLABのplotでサイバーパンク風のグラフを作成
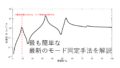
結論から申し上げると、下図のようにサイバーパンク風のグラフが作成できました。
結構簡単です。

図2
サイバーパンク風のグラフは光が「じわっと」にじみ出ているような線が特徴的です。また、光が滲んでいるようにするには背景を黒系の色にした方がいいです。
figureの背景を黒くする
以下のコードで背景を黒くすることができます。
figure
whitebg('black')
plot(0,0)

図3
plotの線の色を薄くする
次に、光が「じわっと」にじみ出ているような線の作り方についての解説です。図2の線の拡大図が図4です。線の中心部の色が濃く、外側になるにつれてだんだんと色が薄くなっているのがわかると思います。

図4
では、plotで色を薄くするにはどのようにするのでしょうか?
実は、すごい簡単なコードで薄くすることができます。下記コードが例で図5が出力されます。
close all

x=0:0.5:100;
y=x;
y2=2*x;
y3=3*x;
y4=4*x;
y5=5*x;

figure
h1 = plot(x,y,'c','linewidth',10); h1.Color(4)=0.2;
hold on
h2 = plot(x,y2,'c','linewidth',10); h2.Color(4)=0.4;
h3 = plot(x,y3,'c','linewidth',10); h3.Color(4)=0.6;
h4 = plot(x,y4,'c','linewidth',10); h4.Color(4)=0.8;
h5 = plot(x,y5,'c','linewidth',10); h5.Color(4)=1;
legend('h1.Color(4)=0.2','0.4','0.6','0.8','1')

つまり、線の中心が濃くて、線の外側が薄くすれば良いので、下記コードのようにplotを重ねればよいですよね。
h = plot(x,y,'c','linewidth',10); h.Color(4)=0.1;
hold on
h = plot(x,y,'c','linewidth',8); h.Color(4)=0.1;
h = plot(x,y,'c','linewidth',6); h.Color(4)=0.1;
h = plot(x,y,'c','linewidth',4); h.Color(4)=0.1;
h = plot(x,y,'c','linewidth',2); h.Color(4)=0.1;
h = plot(x,y,'c','linewidth',1); h.Color(4)=0.1;
MATLABプログラム
では図2をどのように作成しているのかというと、下記コードです。
close all

x=0:0.5:100;
y=rand(1,length(x));

figure
plot(x,y,'c','linewidth',1)
hold on
for ii1=20:-5:5
h1 = plot(x,y,'c','linewidth',ii1); h1.Color(4)=0.1;
end
whitebg('black')
title('CYBERPUNK')
コメント